
A narrow niche where fifteen hundred visits beat fifty thousand
A platform for IT asset and service management, sold into the US market. The previous agency wanted to move into broad queries because “there is no volume in ITAM”; we measured deal value instead and stayed in the niche. For the first two months we wrote nothing and fixed rendering and indexation, then replaced one generic Features page with a page per use case, and from month twenty added work on visibility in AI answers.
- Industry
- ITAM/ITSM platform
- Market
- US
- Period
- 24 months
- Metric
- Organic visits a month
- Starting point
- 1,500
- Result
- 6,600
- Growth
- +340%
- Main work
- Use-case structure, vendor comparisons, vertical pages, AI search from month twenty
Figures are taken from the client's own analytics for the period stated.
The dip in month 22 is not a mistake: zero-click share rose after AI Overviews rolled out. Visits fell, enquiries did not – part of the audience now sees the answer in the results and arrives ready.
Numbers from the client's analytics
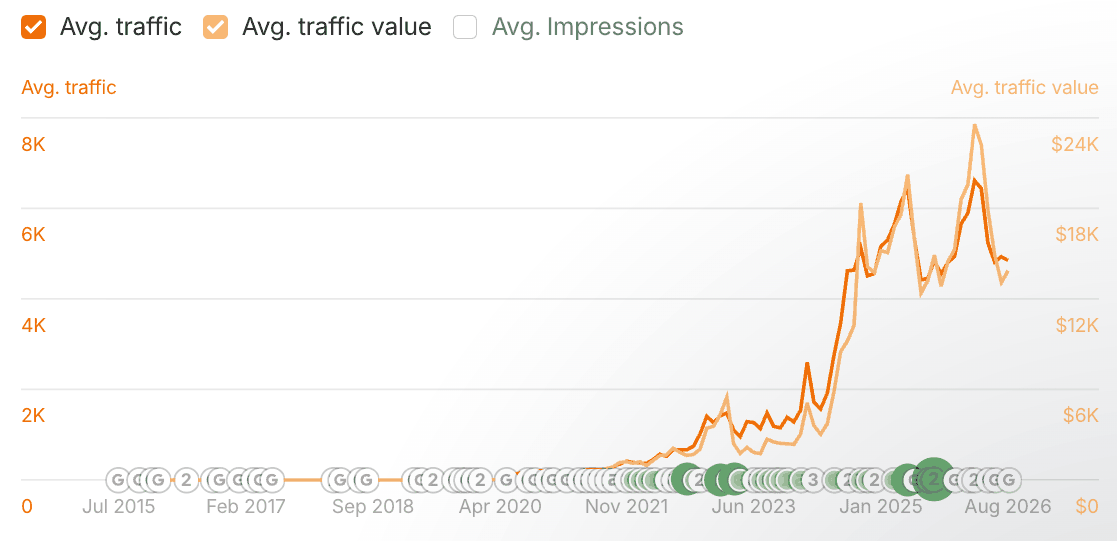
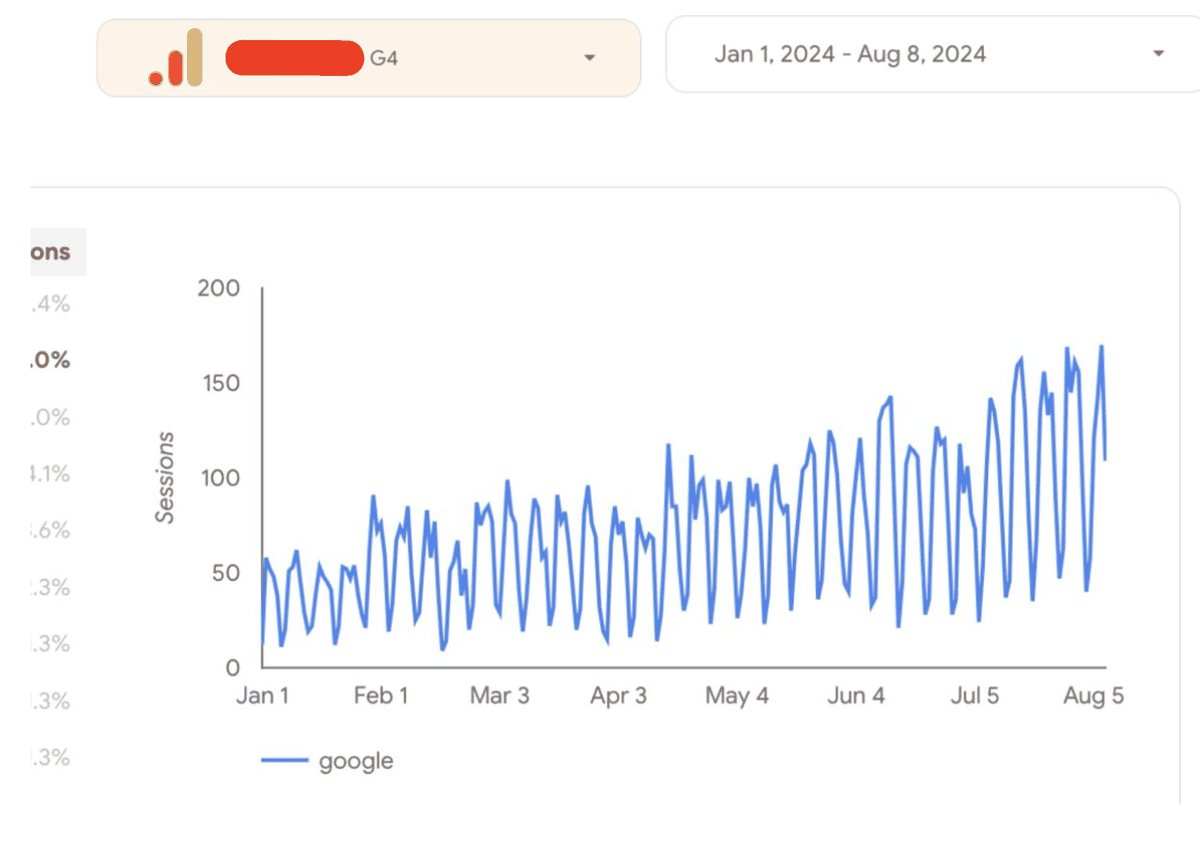
Screenshots are exports from the client's tools for the period stated, unretouched.
Three things holding the project still
The demand existed, the pages did not
The platform covered fifteen or so scenarios – asset inventory, licence management, service desk, change management. All of it lived on a single Features page with a bulleted list. People searched for a specific job, landed on a generic page and left.
Documentation was pulling the traffic
The knowledge base ranked for commercial queries instead of the product pages. The classic enterprise-software story: the docs are written carefully, the landing pages are written last.
The niche looked dead, it was merely narrow
Even in the US, ITAM search volume is modest, and the previous agency used that to argue for broad queries like “IT management software”. We measured deal value rather than volume: fifteen hundred visits in this niche are worth more than fifty thousand in a mass market.
Two years, stage by stage
We write nothing
Audit, logs, indexation review. Found and fixed: integration cards rendering only in JavaScript, duplicates from knowledge-base filters, missing canonicals on per-release versions of pages. Built a demand map of 340 queries and split it by use case.
Traffic sits still at 1,500 visits. Only impressions and indexed pages move.
A page per use case
Designed and shipped landing pages for each scenario: asset inventory, licence management, service desk, CMDB, change management. Separated the knowledge base from product pages by intent – rewritten headings and internal links, no noindex.
The first real shift: 1,720 visits by the end of month four. Use-case queries start landing people on the right pages.
Comparisons and migrations
Wrote comparisons against the category leaders and “replace <vendor>” pages – in enterprise software that is the highest-converting query type there is. Added integration pages for common monitoring and HR systems. Outreach started in parallel across US trade publications and sysadmin communities.
2,550 visits by month nine. First deals from queries about moving off heavyweight enterprise platforms.
Glossary and vertical pages
Expanded up the funnel: an ITAM and ITSM glossary, breakdowns of ITIL 4 and ISO/IEC 19770, and vertical pages for healthcare, higher education and financial services – the three verticals with the most US deployments. Every cluster closed with a term → use case → product chain.
6,600 visits by the end of year two. Non-branded traffic went from 34% to 71% of the total.
A separate workstream
We measured visibility across ChatGPT, Perplexity and AI Overviews on 200 queries from the niche – the client was named nowhere. Key pages were rewritten to be citable: concrete numbers instead of vague claims, comparison tables, direct answers in the opening paragraph, references to the standards. Added schema and llms.txt, and started work on independent ITAM roundups.
Four months later the client is named in 31% of answers in the niche. AI Overviews reached the US earlier than other markets, so some of those visits never arrive – the answer is in the results.
Want the same breakdown for your project?
Our Head of Inbound Sales will look at your site and niche and tell you what you can realistically expect. Including when the answer is “not much”.
Let's see what's holding your product back
We'll go through your site and niche and show you where the losses are. Free, and the document is yours.